As with the other projects in this series, this is a participatory project. I asked people a simple question: If Dinosaurs were in High School, who would they be? What High School social group would each species belong to? Would a Duckbill be a Jock, a Geek, or a Goth? How about a Tyrannosaurus rex, or a Triceratops?
The answers were logged into a chart and analyzed statistically and for their implications.
This project focuses on our perception of dinosaurs’ relative social status and identities. By asking participants which High School Social Category is most analogous to which Dinosaur Species, and why, we can understand more about the way we project personas onto certain dinosaurs, which in turn can tell us just as much about ourselves as it does about dinosaurs.
While I expected there to be a reasonably strong association between certain dinosaurs and social categories (Tyrannosaurus and Jock, for instance), the results turned out to create a surprisingly extensive web of associations between dinosaurs and social categories. It seems that people really do see many dinosaurs as having specific personalities that correspond with human personalities. The origin of these putative personalities probably derives from many sources, including pop culture, the posture and body types of the dinosaurs, and the basic human inclination to project ourselves onto everything else in the universe–to see everything in our terms.
You can download the original form here and play at home!
The book contains the most extensive summary of the results and findings. It featured a large fold-out poster, which can also be found at its full size in the PDF.
The data from this survey has been extensively analyzed. Most of the following charts were included in the book in somewhat edited forms, but can also be downloaded individually here in their native states as large-format posters.
Quantitative Data Part 1: Distribution of Votes for Species’ Social Categories
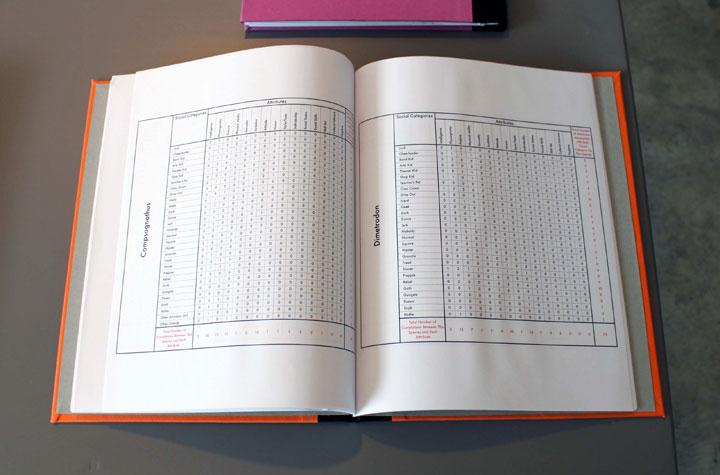
Quantitative Data Part 2A: Distribution of Votes for Attributes by Species and Social Category (This was Chris’ first really huge poster–you’ve gotta love a 3×6′ poster that consists of almost nothing but 10-point type!)
Quantitative Data Part 2B: Summary of Distribution of Votes for Attributes by Social Category
Qualitative Data: Participants’ Extended Descriptions of Selected Attributes (the latest version of this file is from 2009 and does not include the last round of data)
You can also download this now-outdated, but still-interesting poster, which summarized the project as it stood in 2009.
